
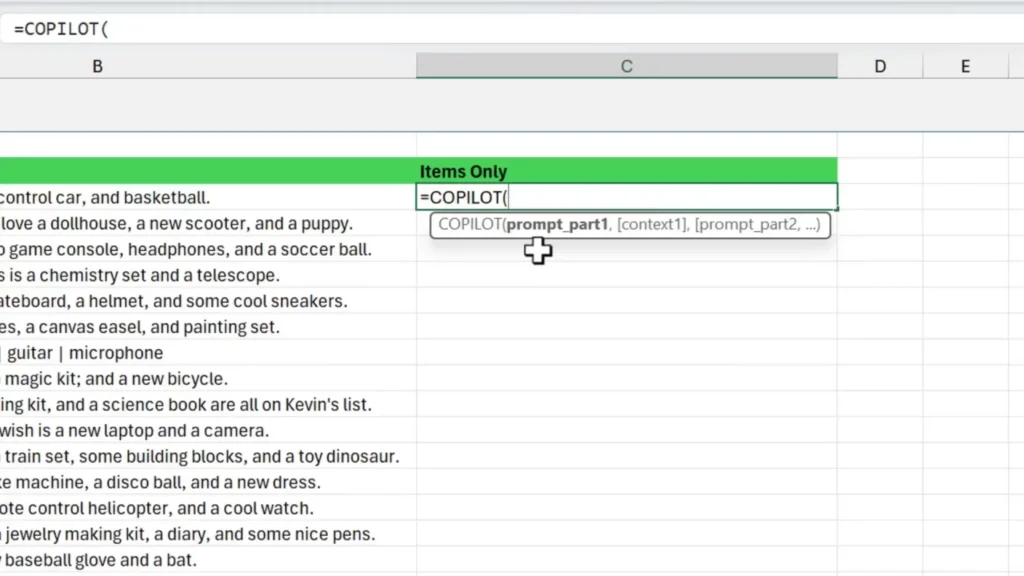
Most Excel users waste hours on tasks that AI handles in seconds. Building complex formulas, formatting reports, and running data analysis slow teams down. Microsoft Copilot in Excel solves this problem by allowing users to manipulate data using natural language.
Instead of writing complex formulas, users can simply type a plain English prompt. For example, the old way required memorizing syntax like =SUMIF(B2:B100,"North",C2:C100). The new way requires nothing more than typing: “Calculate total sales for the North region.”
It is important to note that accessing these features requires a paid Microsoft 365 Copilot license, which is an add-on to a standard Microsoft 365 subscription. For organizations willing to invest, this tool transforms how teams interact with data.
This guide provides exactly what is needed to get started. It includes 50 ready-to-use copy-paste prompts categorized by use case, real examples with context, tips for better results, and common mistakes to avoid.
What Are Copilot Prompts in Excel?
Copilot prompts for Excel are plain-English instructions typed directly in the Copilot pane. They command the AI assistant to perform specific actions on the active spreadsheet. These prompts are used to analyze data, generate formulas, clean datasets, and create summaries.
Users do not need technical knowledge or coding skills. By using the best Copilot prompts Excel offers, business professionals can bypass tedious manual work. These instructions help teams:
- Analyze data and find trends
- Create and explain formulas
- Build charts and visuals
- Generate reports and summaries
- Clean and standardize data
Here is a simple comparison of traditional methods versus using AI prompts:
| Without Copilot | With Copilot Prompt |
|---|---|
| Write a complex VLOOKUP formula | “Find matching values from this table.” |
| Manually remove duplicates | “Remove all duplicate rows.” |
| Build a pivot table from scratch | “Summarise sales by region and month” |
👉Full Prompt Guide: Microsoft Copilot Prompts Guide 2026
Licensing and Setup — What You Need Before Starting
Organizations must meet specific requirements to use these features. Microsoft 365 Copilot requires a paid add-on license. It is not included in the base Microsoft 365 subscription.
Furthermore, the data must be formatted as an Excel Table (via Insert → Table). The AI cannot read unformatted ranges or loosely scattered cells. The tool currently works best in Excel for Windows and Excel for the Web. Mac support is improving, but has not reached full feature parity yet.
Checklist for getting started:
- Microsoft 365 Business or Enterprise plan
- Microsoft 365 Copilot add-on license
- Data formatted as an Excel Table
- Excel for Windows or Web (recommended)
For the latest details on deployment, review Microsoft’s official Copilot requirements documentation.
Microsoft Copilot operates by reading a structured Excel Table. It processes the plain English request, understands the context of the data, and generates formulas, insights, charts, or summaries as an output.
This functionality is powered by the Microsoft Azure OpenAI Service. It works best with structured Excel Tables, clean column headers, and consistent data formats for dates, numbers, and text.
The workflow is simple:
Your Data (Excel Table) → Your Prompt (plain English) → Copilot Output (formula/insight/chart/summary)
Tips to Write Better Copilot Prompts in Excel
Writing effective instructions ensures accurate results. Follow these tips to optimize your Excel Copilot prompts list.
Tip 1 — Be Specific
Bad: “Analyze data.”
Good: “Analyze this sales data and show the top 5 products by revenue in Q3”
Tip 2 — Mention the Output Format
Bad: “Show results.”
Good: “Show results in a table sorted by highest to lowest.”
Tip 3 — Add Context
Bad: “Compare performance.”
Good: “Compare this year vs last year revenue based on the Year and Revenue columns.”
Tip 4 — Reference Column Names
Bad: “Calculate growth.”
Good: “Calculate percentage growth using the Revenue 2023 and Revenue 2024 columns.”
Tip 5 — Use Step-Based Prompts for Complex Tasks
Bad: “Give me a report.”
Good: “Analyze sales by region, identify the top 3 regions, and summarize in 3 bullet points.”
50 Powerful Copilot Prompts for Excel (Copy & Paste Ready)
Use these Copilot Excel examples to automate daily tasks. Simply copy and paste the text into the Copilot pane.
Data Analysis Prompts
Analyse this dataset and identify the top 5 trendsFind the top 10 performing products by total revenueIdentify patterns in monthly sales over the last 12 monthsHighlight any anomalies or unusual values in this datasetCompare this year vs last year performance using the Revenue columnIdentify the highest and lowest values in the Sales columnSegment customers based on total purchase value into High, Medium, and Low groupsAnalyse revenue growth trends by quarterShow the top 5 regions by total sales amountDetect outliers in the Profit Margin column and flag them
Formula Generation Prompts
Create a formula to calculate total revenue from the Sales and Quantity columnsGenerate a profit margin formula using the Revenue and Cost columnsCreate a formula to calculate percentage growth from 2023 to 2024Build a formula to calculate the average monthly salesGenerate a COUNTIF formula to count orders above 500Create an IF formula to flag sales that missed the monthly targetCalculate year-over-year growth percentage for each productGenerate a running total formula for the Revenue columnCreate a formula to calculate a 10 percent discount on all values in the Price columnBuild a formula to calculate tax at 18 percent on the subtotal column
Data Cleaning Prompts
Remove all duplicate rows from this datasetClean and standardise all entries in the Country column to consistent formattingFix any formatting issues in the Date column and convert to DD-MM-YYYY formatIdentify all rows with missing values and highlight themNormalise all text entries in the Product Name column to title case
Charts and Visualization Prompts
Note: Copilot can suggest and insert basic charts into Excel. It does not build fully interactive dashboards natively.
Create a bar chart showing total sales by product for this monthGenerate a line chart showing revenue trends over the last 12 monthsBuild a pie chart showing the percentage revenue contribution by regionCreate a column chart comparing this year vs last year sales by quarterVisualise monthly sales growth as a line graph using the Month and Revenue columnsSuggest the best chart type for this dataset and explain whyCreate a chart showing the top 10 customers by order valueBuild a visual comparison of profit margins across all product categoriesGenerate a chart highlighting the months with the lowest sales performanceCreate a summary chart showing KPI performance against targets
Reporting and Summary Prompts
Create a summary of this dataset highlighting the 3 most important insightsGenerate a business performance report based on this monthly sales dataSummarise key trends and insights from this data in 5 bullet pointsCreate an executive summary of this quarterly financial dataGenerate a weekly sales performance summary for the sales teamBuild a monthly report showing revenue, costs, and profit by departmentCreate a financial summary showing total income, expenses, and net profitSummarise the top trends, risks, and opportunities from this datasetGenerate 3 data-driven insights suitable for a management presentationCreate a presentation-ready summary of this dataset in plain language
Automation and Workflow Prompts
Note: Copilot in Excel automates analysis within the current session. For recurring or scheduled automation, Power Automate is required.
Automate the analysis of this dataset and highlight key changes from last monthGenerate a reusable template to track and report monthly KPIsCreate a structured workflow to update and refresh this data report each weekAutomate calculations for new rows added to this sales tableBuild a tracking system to monitor KPI performance against monthly targets
Real-World Use Cases of Copilot Prompts in Excel
Different departments leverage Microsoft Copilot Excel prompts to achieve distinct goals. Here is how various teams apply these instructions to their daily workflows.
Finance Teams
Finance departments use AI for monthly financial reporting, budget tracking, and variance analysis.
Example prompt: "Summarise budget vs actual spend by department and highlight variances above 10 percent"
Sales Teams
Sales professionals rely on Copilot for pipeline tracking, revenue trend analysis, and achievement reporting.
Example prompt: "Analyse sales performance by rep and flag anyone below 80 percent of their monthly target"
Marketing Teams
Marketing departments track campaign performance, channel ROI, and lead conversions.
Example prompt: "Calculate ROI for each marketing channel using the Spend and Revenue columns"
HR Teams
Human resources teams manage headcount, track attendance, and analyze compensation data.
Example prompt: "Summarise headcount by department and identify departments with attrition above 15 percent"
Operations Teams
Operations staff track process efficiency, monitor supply chains, and analyze vendor performance.
Example prompt: "Identify suppliers with delivery delays above 5 days and summarise their impact on total orders"
Common Mistakes to Avoid
Users often encounter errors when first adopting Copilot for Excel use cases. Avoid these common pitfalls to ensure smooth operation.
Mistake 1 — The data is not in a formatted Excel Table
Copilot works only with structured Tables.
Fix: Select your data range and go to Insert → Table before using Copilot.
Mistake 2 — Prompts are too vague
“Analyze this” gives poor results.
Fix: Always reference specific column names and expected output.
Mistake 3 — Expecting interactive dashboards from Copilot alone
Copilot can insert charts, but cannot build fully interactive dashboards natively.
Fix: Use Power BI or Excel’s built-in dashboard features for that.
Mistake 4 — Confusing Excel Copilot with Power Automate
Excel Copilot works within the session only.
Fix: For scheduled or recurring automation, use Power Automate alongside Copilot.
Mistake 5 — Ignoring column header quality
Vague headers like “Col1” or “Data” confuse the AI.
Fix: Use clear, descriptive column headers like “Monthly Revenue” or “Customer Region.”
Benefits of Using Copilot Prompts in Excel
Adopting Microsoft Copilot brings immediate advantages to an organization. The primary benefits include:
- Saves hours of manual work on reports and analysis
- Reduces formula errors and removes dependency on Excel experts
- Makes data analysis accessible to non-technical team members
- Speeds up decision-making with instant insights
- Improves data accuracy through automated cleaning and standardization
Advanced Tips for Power Users
Once users master basic prompts, they can combine techniques for deeper insights. Read our [Internal Link: Microsoft Copilot Guide] for more comprehensive strategies.
Chain prompts for deeper analysis
First: "Analyse sales by region" → Then: "Now summarise the top 3 regions in 3 bullet points" → Then: "Format this as a table sorted highest to lowest"
Combine Copilot with Power Query
Use Power Query to clean and transform raw data first. Then, use Copilot prompts for analysis and reporting on the clean dataset.
Use named ranges and clear column headers
Copilot produces significantly better outputs when column names are descriptive and consistent across the table.
Connect Excel Copilot outputs to Power BI
Export Copilot-generated summaries and structured data to Power BI for advanced visual dashboards and sharing with leadership.
Use Copilot to explain existing formulas
Prompt: "Explain what this formula does and suggest how to improve it" — great for auditing inherited Excel files.
Master Microsoft Copilot in Excel
Microsoft Copilot transforms Excel from a manual spreadsheet tool into an intelligent data assistant. The right Copilot prompts for Excel unlock its full power for analysis, reporting, and automation. Anyone can now work with data faster and more accurately.
Bookmark this guide and start with five prompts from any category. The more specific the instructions, the better the results will be. Pair Copilot with Power Automate and Power BI to build a full Microsoft 365 productivity stack. To learn more about integration strategies, view our Copilot Consulting Services
Want to implement Microsoft Copilot across your organization and automate your Excel workflows?
We help businesses:
- Implement Microsoft 365 Copilot the right way
- Build Power Automate workflows connected to Excel and SharePoint
- Train teams to use Copilot prompts effectively
- Migrate from legacy tools to a full Microsoft 365 productivity stack
Frequently Asked Questions
What are Copilot prompts in Excel?
Copilot prompts are plain English instructions typed into the Copilot pane in Excel. They allow users to analyze data, generate formulas, clean datasets, and create summaries without writing complex functions manually.
Do I need a special license to use Copilot in Excel?
Yes. Microsoft 365 Copilot requires a paid add-on license separate from a standard Microsoft 365 subscription. Check Microsoft’s official licensing page for the latest pricing and plan requirements.
Can Copilot create formulas in Excel automatically?
Yes. Users can ask Copilot to generate formulas in plain English, such as “Create a formula to calculate percentage growth from 2023 to 2024,” and Copilot will write and insert the formula.
Can Copilot analyze large Excel datasets?
Yes, provided the data is formatted as a structured Excel Table with clear column headers and consistent data. Copilot performs best on clean, well-organized datasets.
How do I get better results from Copilot in Excel?
Use specific prompts that reference column names, mention the desired output format, and provide context such as time periods or comparison criteria. The more detail provided, the more accurate Copilot’s output will be.
